India Records Highest-Ever FDI of $94.53 Billion in FY26: Where the Money Came From
India received a record $94.53 billion in total FDI in FY2025-26, up about 17% from the previous year. Singapore led equity investment, software and hardware was the top sector, while Maharashtra attracted the most FDI equity.
Modern Indian manufacturing and technology facilities representing India's record foreign direct investment inflows in FY2025-26
Table of Contents (25 sections)
India recorded its highest-ever annual Foreign Direct Investment inflow of $94.53 billion in financial year 2025-26, Commerce and Industry Minister Piyush Goyal said on Friday, highlighting the figure as the government's Make in India initiative completed 12 years.
The record represents approximately 17% growth from $80.62 billion in FY2024-25, according to Reserve Bank of India data reproduced by the Department for Promotion of Industry and Internal Trade.
The previous annual record was about $84.84 billion in FY2021-22.
Goyal also said cumulative FDI received between FY2014-15 and FY2025-26 reached $843 billion. The government has cited the figure as evidence of India's increased integration with global investment and manufacturing networks.
Recommended Reading
Related Stories & In-Depth Guides
Curated editorial perspectives matching this topic.
Iran’s economy contracted by 10.1% year-on-year during the first quarter of its current Persian calendar year, according to official data, with a collapse in oil and natural-gas activity driving much of the decline. The figures cover the first months of the US-Israel conflict with Iran, although the
Sensex and Nifty rebounded on September 25 after Thursday's sharp selloff. At 2:35 PM IST, Sensex was up 328 points at 73,908 while Nifty gained 68 points to 23,131, helped by value buying and softer crude.
There is, however, an important distinction for investors and readers:
The $94.53 billion figure represents gross or total FDI inflows—not net FDI retained in India.
Net FDI was considerably lower after accounting for repatriation, disinvestment and outward investment by Indian companies.
Understanding that difference is essential to interpreting the record accurately.
Key Numbers at a Glance
Indicator
FY2025-26
Total/gross FDI inflow
$94.53 billion
Growth over FY25
17%
DPIIT FDI equity inflow
$58.85 billion
Reinvested earnings
$25.56 billion
Other capital
$6.68 billion
Equity capital of unincorporated bodies
$3.44 billion
Cumulative FDI since April 2000
$1.166 trillion
Cumulative FDI FY2014-15 to FY2025-26
$843 billion
Net FDI
About $7.65 billion
The total-FDI components and long-term cumulative figure come from RBI data compiled by DPIIT.
Why $94.53 Billion Is a Record
RBI's historical series shows India's annual total FDI inflows rising from $36.05 billion in FY2013-14 to $94.53 billion in FY2025-26.
Recent annual figures were:
Financial year
Total FDI inflow
FY2021-22
$84.84 billion
FY2022-23
$71.36 billion
FY2023-24
$71.28 billion
FY2024-25
$80.62 billion
FY2025-26
$94.53 billion
The FY26 increase was therefore large enough to surpass the previous peak recorded four years earlier.
The RBI/DPIIT series marks FY26 data as provisional, meaning figures may still be subject to reconciliation or later revision.
Is $94.53 Billion All New Equity Investment?
No.
This is one of the most important distinctions in the FDI data.
The $94.53 billion total FDI figure combines several components.
RBI's FY26 breakdown includes approximately:
$58.85 billion in conventional FDI equity inflows;
$3.44 billion in equity capital of unincorporated bodies;
$25.56 billion in reinvested earnings; and
$6.68 billion in other capital.
Together, those components produce total FDI inflows of approximately $94.527 billion, rounded to $94.53 billion.
So a headline saying India received $94.53 billion in new foreign equity investment alone would be inaccurate.
FDI Equity Inflows Rise to $58.85 Billion
DPIIT's dedicated FDI-equity data shows India received $58.846 billion in FDI equity inflows during FY2025-26.
That compares with around $50 billion a year earlier and represents an increase of roughly 18%.
More than 90% of equity inflows were received through the automatic route, according to government statements, meaning those investments generally did not require case-by-case prior government approval, subject to sectoral rules and applicable regulations.
Which Country Invested the Most in India?
Singapore was India's largest source of FDI equity during FY2025-26.
According to DPIIT:
Rank
Country
FY26 FDI equity
Share
1
Singapore
$19.80 billion
34%
2
United States
$11.17 billion
19%
3
Mauritius
$6.58 billion
11%
4
Japan
$3.75 billion
6%
5
Netherlands
$3.37 billion
6%
Together, the top five accounted for a large majority of India's FDI equity inflows during the year.
Singapore's position is particularly notable because it contributed approximately one-third of total FDI equity.
US Investment More Than Doubles
The United States contributed approximately $11.17 billion, making it India's second-largest source of FDI equity in FY26.
That compares with around $5.46 billion in FY2024-25, meaning US equity investment more than doubled year-on-year.
The jump comes as American companies continue expanding operations in areas including:
technology;
data centres;
global capability centres;
electronics;
cloud infrastructure;
financial services;
and advanced manufacturing.
The country-level number does not mean all US-linked corporate announcements are included immediately or in exactly the same reporting period; FDI statistics measure actual recorded financial flows rather than headline investment commitments.
Which Sector Received the Most FDI?
Computer Software & Hardware was India's largest FDI equity recipient in FY2025-26.
DPIIT reported:
Rank
Sector
FDI equity
Share
1
Computer Software & Hardware
$13.95 billion
24%
2
Services
$10.01 billion
17%
3
Trading
$4.01 billion
7%
4
Non-conventional Energy
$3.02 billion
5%
5
Food Processing Industries
$3.01 billion
5%
Technology therefore accounted for almost one-quarter of FDI equity entering India during the financial year.
Why Technology Leads FDI
India's large digital economy, software workforce and expanding cloud, artificial-intelligence and data-centre ecosystem continue to attract multinational investment.
Foreign companies are also increasingly using India for functions beyond traditional outsourced services, including:
product engineering;
artificial-intelligence development;
cybersecurity;
finance;
research and development;
global operations;
chip design;
and high-value corporate functions.
That broader shift helps explain why software and hardware remains a major category in foreign investment statistics.
It does not mean all technology investment translates immediately into manufacturing capacity or employment, however. The economic impact depends on the nature of individual projects.
Renewable Energy Attracts More Than $3 Billion
The non-conventional energy sector attracted around $3.02 billion in FDI equity, accounting for roughly 5% of FY26 inflows.
The category reflects international interest in India's expanding renewable-energy market, including solar, wind and related infrastructure.
India's future investment requirements in power generation, transmission, energy storage and clean-energy manufacturing could keep the sector significant for foreign investors.
Which State Received the Most FDI?
Maharashtra ranked first among Indian states and Union Territories for FDI equity inflows during FY2025-26.
The top five were:
Rank
State / UT
FDI equity
Share
1
Maharashtra
$18.42 billion
31%
2
Karnataka
$12.94 billion
22%
3
Delhi
$6.18 billion
11%
4
Gujarat
$5.71 billion
10%
5
Tamil Nadu
$4.72 billion
8%
Those five destinations together accounted for more than four-fifths of the country's reported FDI equity.
Maharashtra and Karnataka Dominate
Maharashtra alone attracted approximately 31% of India's FDI equity inflows.
Karnataka accounted for another 22%.
Together, the two states received more than half of total equity inflows reported by DPIIT during the year.
Their concentration reflects the role of major economic centres such as Mumbai, Pune and Bengaluru in finance, technology, manufacturing, services and multinational corporate operations.
It also highlights a policy challenge: attracting larger shares of foreign capital to additional states and regions.
India Has Received More Than $1.16 Trillion Since 2000
RBI's long-term data shows cumulative total FDI inflows of approximately $1.166 trillion between April 2000 and March 2026.
Of this, the government says $843 billion arrived between FY2014-15 and FY2025-26.
The latter figure was highlighted by Piyush Goyal on September 25 as Make in India completed 12 years.
Why Is This FDI Figure in the News Today?
The $94.53-billion FY26 record itself is not a brand-new September data release.
RBI reported the FY26 figures in May, while DPIIT published detailed country, sector and state data subsequently.
The reason the number returned to headlines on September 25, 2026 is that Commerce and Industry Minister Piyush Goyal highlighted it while marking the 12th anniversary of Make in India.
That distinction matters for accurate news framing.
The fresh development is the government's anniversary assessment and renewed emphasis on the record—not a newly completed financial year today.
What Is Make in India?
Prime Minister Narendra Modi launched Make in India on September 25, 2014 with the goal of encouraging manufacturing, investment, innovation and infrastructure development.
A government backgrounder marking the programme's 12th anniversary says policies associated with the broader manufacturing strategy now include:
Production Linked Incentive schemes;
National Single Window System;
PM GatiShakti;
industrial corridors;
industrial land banks;
semiconductor programmes;
and sector-specific manufacturing initiatives.
Prime Minister Modi said on September 25 that the initiative had resulted in more production, investment and exports across sectors. That represents the government's assessment of the programme's impact.
PLI Investment Reaches ₹2.40 Lakh Crore
Goyal also highlighted the performance of India's Production Linked Incentive schemes.
As of March 31, 2026, he said PLI programmes had resulted in:
₹2.40 lakh crore in actual investment;
₹23.8 lakh crore in production and sales;
₹15.2 lakh crore in exports; and
more than 14.6 lakh direct and indirect jobs.
He identified sectors including electronics and telecom, pharmaceuticals, medical devices, automobiles, IT hardware and speciality steel among beneficiaries.
These are government programme figures and should be presented as such rather than as independently audited measures of the entire manufacturing economy.
But Net FDI Was Only About $7.65 Billion
The record gross number comes with an important counterpoint.
RBI data showed net FDI of approximately $7.65 billion in FY2025-26, despite $94.53 billion of gross inflows.
Why is the difference so large?
Because net FDI adjusts for money flowing back out through mechanisms including:
repatriation by foreign investors;
disinvestment or sale of existing investments;
and outward direct investment by Indian companies.
Repatriation and disinvestment by foreign investors remained high at approximately $53.58 billion, while Indian companies also increased overseas investment.
Does Low Net FDI Mean the Record Gross Figure Is Wrong?
No.
They measure different things.
Gross FDI tells us how much foreign direct-investment capital entered India before various offsetting outflows.
Net FDI measures the balance after relevant outward movements are taken into account.
Both are economically useful.
A country can therefore simultaneously record:
record gross FDI;
large investor exits or repatriations;
rising overseas investment by domestic companies;
and relatively modest net FDI.
That is what happened in FY26.
For investors, looking only at the $94.53-billion headline would therefore give an incomplete picture.
Why Can Higher Repatriation Occur?
Repatriation is not automatically evidence that foreign investors have lost confidence.
Foreign companies and investment funds may take money out because:
an investment matured;
shares were sold at a profit;
a domestic buyer acquired an overseas investor's stake;
dividends or capital were returned;
or multinational groups reallocated capital.
At the same time, consistently high exits relative to new inflows can reduce the net capital retained by the economy.
For this reason, analysts monitor both gross and net FDI trends.
Why FDI Matters to India
Foreign direct investment differs from short-term portfolio flows because it generally involves a lasting ownership interest in businesses or productive assets.
Depending on the investment, potential economic effects can include:
new factories and infrastructure;
technology transfer;
research and development;
job creation;
export capacity;
stronger supply chains;
managerial expertise;
and integration with multinational production networks.
Not every FDI dollar produces the same benefits.
An investment in a new factory, for example, can have a different economic effect from the acquisition of an existing company.
That is why policymakers increasingly focus not only on the amount of FDI but also on its quality, sector and long-term domestic value creation.
What Does the Record Mean for Investors?
The FY26 figures suggest India continues to attract significant amounts of foreign capital despite global economic and geopolitical uncertainty.
Three trends stand out.
1. Technology remains central
Software and hardware accounted for 24% of equity inflows.
2. Investment is geographically concentrated
Maharashtra and Karnataka together captured more than half of FDI equity.
3. Gross and net flows are telling different stories
Record incoming investment coexists with substantial repatriation and outbound investment.
That means investors should avoid interpreting a single headline number as a complete measure of the investment environment.
What Could Drive FDI in the Coming Years?
Potential areas capable of attracting further overseas investment include:
semiconductors;
electronics;
artificial intelligence and data centres;
renewable energy;
batteries and energy storage;
electric vehicles;
defence production;
pharmaceuticals;
food processing;
advanced manufacturing;
logistics;
and Global Capability Centres.
The actual level of future FDI will depend on global growth, financing conditions, trade policy, India's domestic demand, regulatory predictability and individual corporate decisions.
The FY26 record does not guarantee that FY27 or future years will set new highs.
Latest Verified Position
As of September 25, 2026:
India recorded $94.53 billion in total/gross FDI inflows during FY2025-26, the highest annual amount in RBI's series.
The figure represents approximately 17% growth from $80.62 billion in FY2024-25.
FDI equity inflows tracked by DPIIT were $58.85 billion.
Singapore was the largest source of equity FDI with $19.80 billion.
The United States ranked second with $11.17 billion.
Computer Software & Hardware was the top recipient sector with $13.95 billion.
Maharashtra led states with $18.42 billion in FDI equity, followed by Karnataka at $12.94 billion.
Cumulative total FDI since April 2000 reached approximately $1.166 trillion.
The government says $843 billion was received between FY2014-15 and FY2025-26.
Net FDI was substantially lower at roughly $7.65 billion after repatriation, disinvestment and overseas investment flows were taken into account.
The $94.53-billion record had already been reported earlier in 2026; Piyush Goyal highlighted it again on September 25 as Make in India completed 12 years.
Frequently Asked Questions
How much FDI did India receive in FY2025-26?
India received approximately $94.53 billion in total FDI inflows, the highest annual figure in the RBI series.
Is $94.53 billion India's highest-ever FDI?
Yes, on the measure of annual total/gross FDI inflows. The previous peak was approximately $84.84 billion in FY2021-22.
How much did FDI grow in FY26?
Total FDI increased by about 17% from $80.62 billion in FY2024-25.
Is $94.53 billion the same as FDI equity inflow?
No. DPIIT's FDI equity figure was approximately $58.85 billion. Total FDI also includes reinvested earnings and other capital components.
Which country invested the most in India?
Singapore ranked first with approximately $19.80 billion, representing 34% of FY26 FDI equity inflows.
How much FDI came from the United States?
The United States contributed approximately $11.17 billion in FDI equity during FY26.
Which sector received the highest FDI?
Computer Software & Hardware ranked first, receiving approximately $13.95 billion or 24% of FDI equity.
Which Indian state attracted the most FDI?
Maharashtra led with approximately $18.42 billion, representing 31% of FDI equity inflows.
How much FDI has India received since 2000?
RBI's cumulative total through March 2026 is approximately $1.166 trillion.
What is India's net FDI?
Net FDI was approximately $7.65 billion in FY26, much lower than gross inflows because of repatriation, disinvestment and outward direct investment.
Did India receive $94.53 billion in FDI on September 25?
No. The figure covers the full April 2025-March 2026 financial year. It returned to the news on September 25 because Piyush Goyal highlighted it on Make in India's 12th anniversary.
Bottom Line
India recorded its highest-ever total FDI inflow of $94.53 billion in FY2025-26, up 17% from the previous year. Singapore led equity investment, Computer Software & Hardware was the top sector, and Maharashtra attracted the most FDI equity.
Net FDI was much lower at about $7.65 billion after repatriation and outward investment. The figure was highlighted again on September 25 as Make in India marked 12 years.
Key Takeaway
India FDI hits record $94.53 billion in FY26.
Singapore #1 source; tech top sector; Maharashtra leads states.
The Rajatheertha Team publishes news, explainers, guides and updates across India and the world. Our coverage follows Rajatheertha's editorial, verification and corrections standards.
The New Delhi Declaration backs more interoperable payment systems and voluntary use of national currencies while calling for diversified critical-mineral supply chains, as India’s expanding semiconductor ecosystem highlights the commercial stakes behind the resilience agenda.
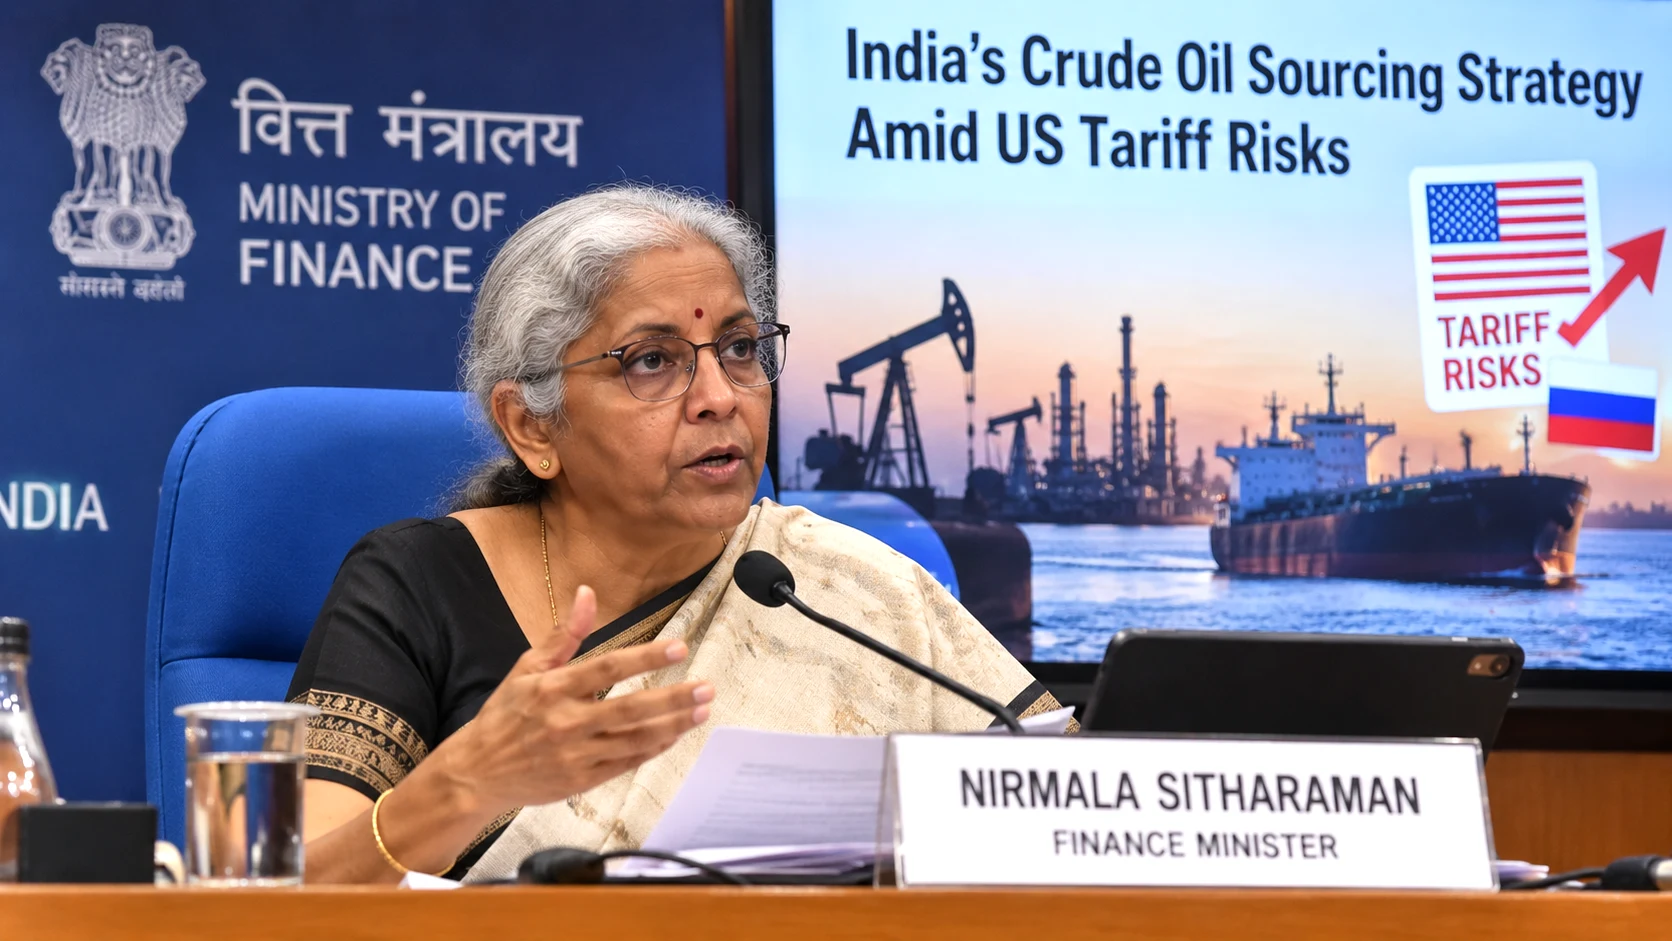
Finance Minister Nirmala Sitharaman says India cannot abruptly abandon Russian crude and will base oil purchases on availability, price and refinery suitability as a new US law raises the risk of tariffs of up to 100% on major Russian-energy buyers.
The Bank of Japan has raised its benchmark interest rate to 1.25%, taking borrowing costs to their highest level in 31 years as policymakers step up efforts to prevent inflation from moving persistently above the central bank’s target.
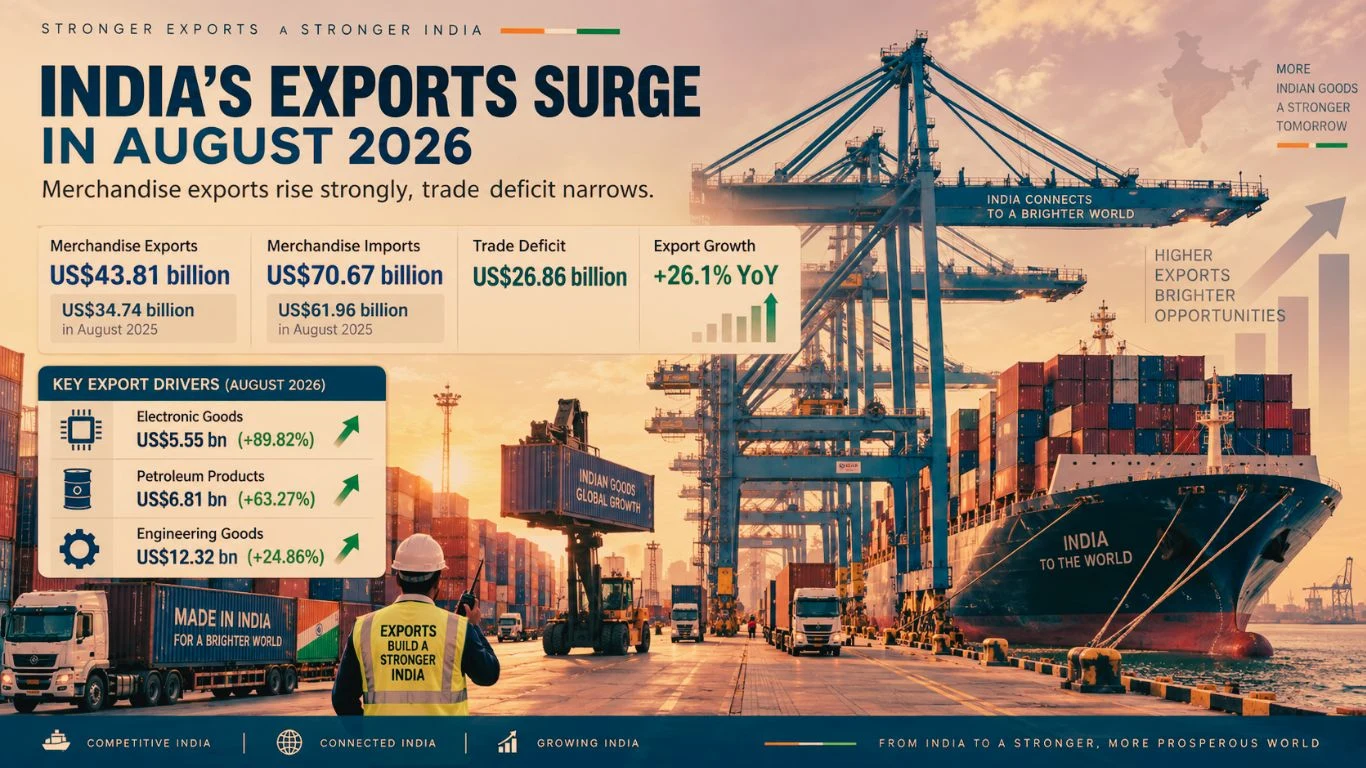
Merchandise exports recorded strong year-on-year growth in August 2026, led by electronics, petroleum products and engineering goods. The goods trade deficit fell sharply from July, helped partly by lower gold imports, although merchandise imports remained elevated at $70.67 billion.
Sensex and Nifty opened higher and extended gains on September 23, led by metals, FMCG and realty stocks as crude oil eased and global cues improved. Bajaj Finance, Hindalco and Tata Steel were among the strongest Nifty gainers.
The claim is confirmed by the Bloomberg Billionaires Index and fresh September 18 reporting. Zhang Yiming’s estimated wealth has climbed to about $105 billion as higher ByteDance valuations and the company’s expanding AI business push him ahead of Gautam Adani.












0 Comments